29 Jun 2026
Breakpoint Conversion Analysis for Stake Optimization in Prolonged Tennis Encounters
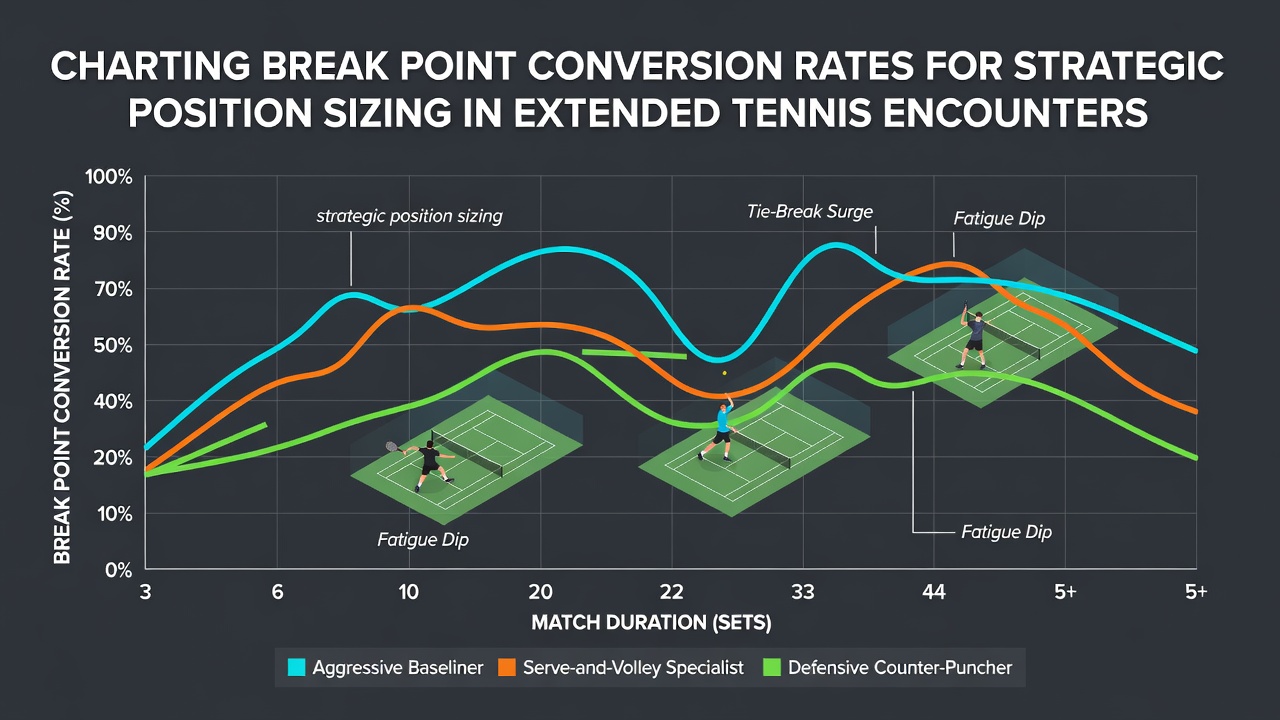
Break points represent critical moments in tennis where one player has the chance to break an opponent's serve, and conversion rates track how often those opportunities result in actual breaks; analysts use these metrics to adjust stake sizes during matches that stretch beyond standard lengths, particularly in best-of-five formats common at Grand Slams. Data from multiple seasons indicate that players maintain conversion rates between 35 and 45 percent on average, though figures fluctuate based on surface type, fatigue levels, and opponent serving patterns, according to performance records compiled across professional circuits.
Core Elements of Breakpoint Metrics
Observers track conversion rates by dividing successful breaks by total break point opportunities, creating a percentage that reveals momentum shifts in real time; researchers have noted that elite players often sustain higher rates during the middle sets of extended encounters while rates dip in deciding sets due to increased pressure. Tournament databases reveal that clay courts produce conversion averages around 42 percent, whereas grass surfaces hover closer to 38 percent because of faster points and fewer prolonged rallies, and these distinctions guide bettors when scaling positions across different events.
Position sizing involves allocating stakes proportionally to perceived edges derived from these rates, with adjustments made as matches progress and fresh data emerges. Those who monitor live statistics adjust downward when conversion rates fall below historical norms for a given player, while incremental increases occur when rates exceed expected thresholds by consistent margins. In June 2026, several major tournaments supplied fresh datasets showing that matches exceeding three hours featured conversion volatility spikes of up to 12 percent compared with shorter contests.
Integrating Charts into Stake Decisions
Charts plotting conversion rates over set-by-set intervals allow for visual identification of trends, such as declining performance in later stages of five-set battles or sudden improvements following medical timeouts. Bettors reference these visuals alongside serve percentage data and unforced error counts to refine allocations, ensuring that larger stakes align only with sustained statistical advantages rather than isolated points. Industry reports from the Asia-Pacific Gaming Council highlight how systematic charting reduces variance in multi-hour encounters by prompting earlier stake reductions when conversion curves flatten.
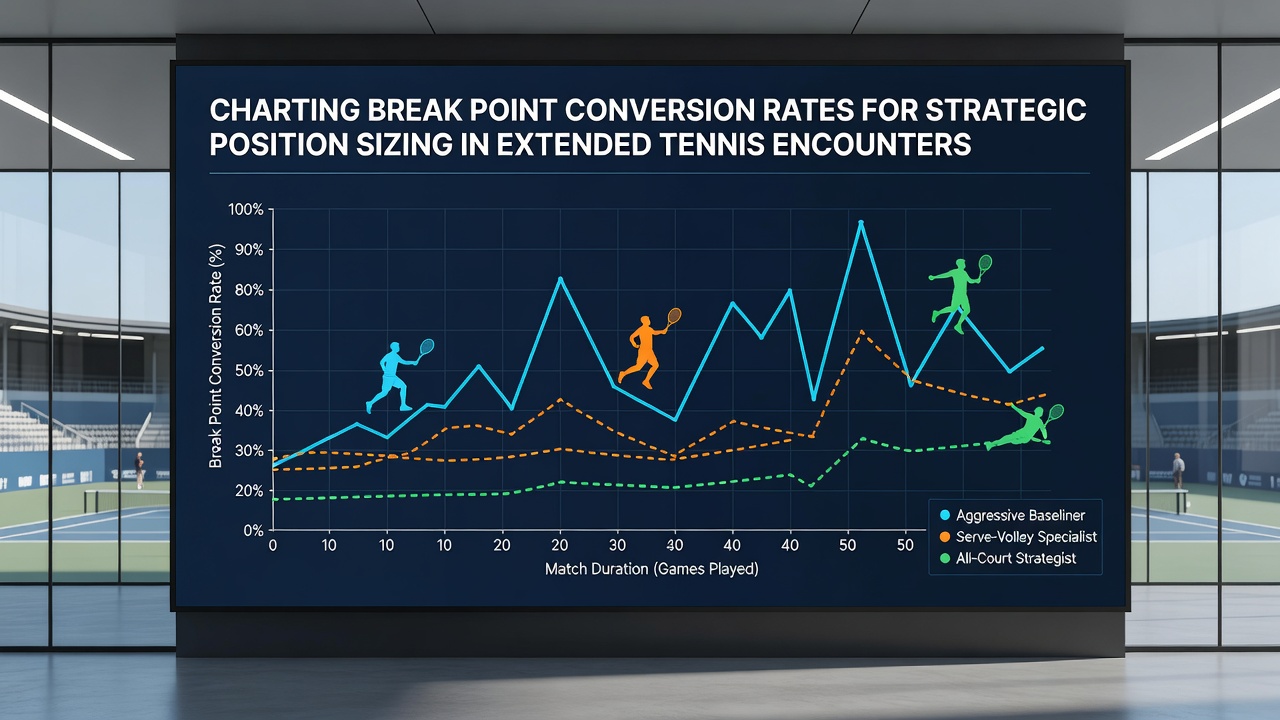
Extended encounters introduce additional variables including weather delays, crowd influence, and physical recovery periods between sets, all of which affect conversion reliability; studies from academic institutions such as the University of Melbourne's sports analytics program demonstrate that incorporating these factors into rate calculations improves the accuracy of projected outcomes by measurable margins. Position sizing models therefore incorporate buffers, scaling stakes conservatively when matches enter tiebreak territory or when one competitor shows fatigue indicators like reduced first-serve accuracy.
Practical Application Across Tournament Stages
Early-round matches on secondary courts often yield cleaner datasets because fewer interruptions occur, allowing straightforward rate comparisons, whereas later stages at premier events feature higher-stakes pressure that alters player behavior and conversion tendencies. Analysts compile historical benchmarks per player and surface, then overlay live tracking to determine whether current performance deviates enough to justify stake modifications. A review published through the Canadian Centre for Gaming Research found correlations between elevated conversion rates in the fourth set and improved hold percentages in subsequent play, providing a basis for incremental position growth during prolonged contests.
Software tools aggregate point-by-point information to generate dynamic charts, updating conversion figures after every game and highlighting inflection points where rates cross predefined thresholds. Bettors combine these outputs with overall match win probabilities to maintain balanced exposure, avoiding overcommitment even when short-term streaks appear favorable. Records from the 2025 season onward show that participants employing rate-based sizing maintained steadier bankroll trajectories through lengthy tournaments compared with fixed-stake approaches.
Conclusion
Conversion rate charting supplies a structured method for sizing positions in tennis matches that extend into multiple sets, drawing on established performance patterns and live updates to inform adjustments. Data from diverse regulatory and academic sources, including the Asia-Pacific Gaming Council and the University of Melbourne, confirm that these metrics capture meaningful variations tied to surface, duration, and player condition. Continued refinement of charting techniques supports more precise allocation strategies as tournaments evolve through 2026 and beyond.