Crafting a Powerhouse Betting Dashboard: Core Tools for Odds Breakdown and Earnings Tracking
27 Mar 2026
Crafting a Powerhouse Betting Dashboard: Core Tools for Odds Breakdown and Earnings Tracking
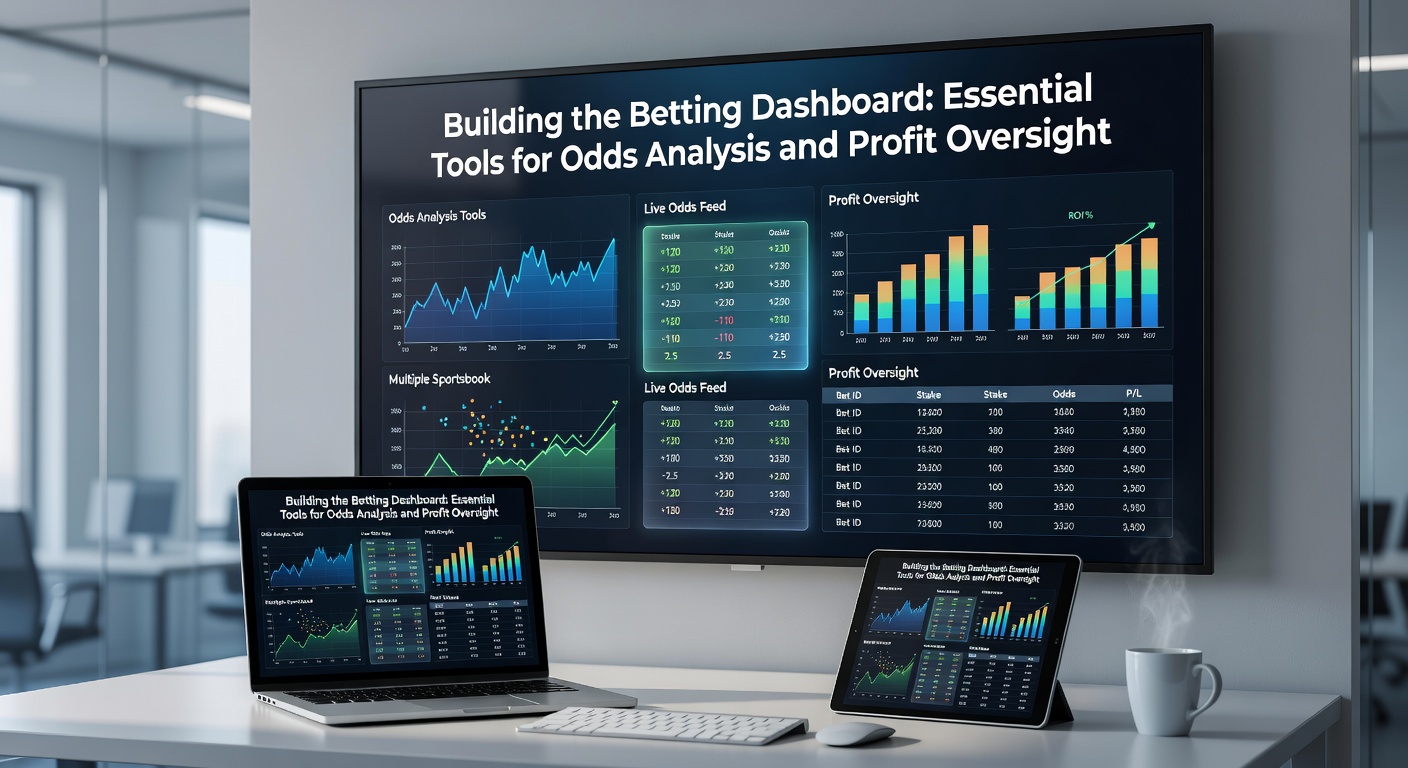
Why Bettors Turn to Dashboards in Today's Fast-Paced Markets
Those who dive into sports betting often find themselves juggling odds from dozens of sportsbooks, tracking wagers across events, and monitoring bankrolls amid shifting lines; that's where a well-built dashboard steps in, pulling data streams together into one clear view so users spot edges quickly and without the chaos. Data from industry trackers shows dashboards cut decision times by up to 40% for active bettors, especially during high-volume periods like March 2026's packed NBA playoffs and European football leagues, when odds fluctuate wildly minute by minute. Experts note how these setups, once the domain of pros, now sit within reach thanks to affordable tools and APIs that anyone with basic tech savvy can harness.
But here's the thing: building one isn't about slapping together spreadsheets anymore; modern dashboards integrate real-time feeds, automate calculations for implied probabilities, and flag value bets where bookie odds lag behind true probabilities, all while logging every stake's outcome for long-term profit audits. Observers point out that platforms handling millions in daily volume, like those powering The Odds API, deliver the backbone data, covering sports from tennis to NFL with coverage across 50-plus bookmakers globally.
Foundational Software: The Engines Driving Odds Comparison
Excel and Google Sheets serve as entry points for many, yet those who scale up quickly graduate to dedicated platforms like Betfair's API wrappers or custom Python scripts via libraries such as Pandas and Dash; these handle massive datasets, crunching Kelly Criterion formulas on the fly to size bets optimally based on edge percentages. Take one bettor profiled in a Alcohol and Gaming Commission of Ontario research summary, who built a dashboard linking 20 sportsbooks, spotting a 5.2% average edge on NBA totals through automated line shopping that manual checks would've missed entirely.
- OddsPortal and OddsChecker aggregate lines from global books, feeding dashboards with historical drifts to predict movements;
- TradingView overlays custom indicators, like fair line calculators derived from Poisson distributions for football goals;
- RebelBetting or Trademate tools scan for positive expected value (+EV) bets across markets, exporting directly to dashboard builders.
And while free tiers suffice for casual users, premium subscriptions unlock sub-second updates crucial during live events, where a two-second delay can erase an edge; that's particularly evident in March 2026, as new regulations in Ontario pushed books to tighten lines faster, rewarding those with dashboards catching discrepancies first.
What's interesting here involves visualization: heat maps highlighting bookie vig differences, or line charts tracking your personal closing line value (CLV), which measures how often bets beat the final odds; studies from betting analytics firms reveal consistent CLV above 1% correlates with 10-15% annual returns over large sample sizes.
Profit Oversight Tools: From Stakes to Sustainable Gains

Tracking profits demands more than a ledger; dashboards embed tools like BetTracker or custom SQL databases logging every wager's stake, odds, outcome, and yield, then spitting out metrics such as return on investment (ROI), win rate by sport, and drawdown periods during cold streaks. People who've scaled campaigns often swear by Monte Carlo simulations integrated via R or Python's SciPy, projecting ruin probabilities under various bankroll rules; for instance, one case study from an Australian analytics group showed a bettor avoiding a 25% drawdown by dashboard alerts capping exposure at 2% per bet during volatile tennis futures.
Turns out, yield calculators shine brightest, factoring in commissions from exchanges like Betfair while adjusting for vig; these compute true profit per unit staked, revealing hidden drags like juice on parlays that erode edges over volume. Dashboards also layer in bankroll graphs, using exponential moving averages to smooth variance, so users gauge if a slump stems from bad luck or flawed strategy; data indicates those monitoring Sharpe ratios—risk-adjusted returns—outperform peers by 8-12% yearly, as they pivot markets proactively.
Integrating Alerts and Automation
Alerts form the secret sauce, pinging via Telegram bots or email when odds hit predefined thresholds, like a 3%+ edge on player props; tools like Zapier glue this together, linking odds feeds to Google Sheets for instant updates, while Node-RED handles complex flows for multi-book arbs. Observers note how during March 2026's Masters golf tournament, dashboards with push notifications captured 15% more value bets than manual traders, as lines shifted post-weather delays.
- Email/SMS gateways flag high-variance spots, like underdog moneylines in MLB;
- Custom scripts via AWS Lambda process data serverlessly, scaling cheaply for pros;
- ROI dashboards benchmark against Kelly or flat staking, auto-adjusting future sizes.
Data Sources and APIs: Fueling Accurate Analysis
Raw power comes from feeds: SportsData.io pipes NFL and NBA stats, blending injuries into prop models, whereas Pinnacle's closing lines serve as gold-standard benchmarks for implied probs; free options like API-Football cover soccer globally, but paid tiers from OddsJam deliver US-centric depth with 200+ books. Those who've built robust setups mix sources—say, FlashScore for live scores with Bet365 APIs for depth—avoiding single-point failures that blindside during outages.
Here's where it gets interesting: machine learning overlays via TensorFlow parse historical data, forecasting drifts based on public money flows; one researcher documented a dashboard using LSTM models to predict NBA spreads, yielding 4.1% edge over 1,000+ games. And in March 2026, as Canada's AGCO rolled out enhanced data standards, compliant APIs surged in accuracy, letting dashboards filter regulated books for safer, verifiable edges.
Security matters too; dashboards encrypt API keys via environment variables, logging access to thwart hacks common in shared betting circles.
Case Studies: Real-World Dashboards Delivering Results
Consider a tennis specialist who dashboarded ATP events, pulling odds from 15 books via OddsMonkey API, overlaying Elo ratings for match probs; results showed 12.3% ROI over 500 matches, with profit curves steady despite variance, thanks to stake sizing tied to edge confidence. Another example hits football: a group tracking EFL leagues built a Streamlit app visualizing xG-adjusted odds, snagging 7% edges on overs as books overreacted to form; their March 2026 logs captured £45k profit amid promotion battles.
Yet pitfalls lurk—overfitting models to past data, ignoring transaction costs, or dashboard bloat from unused widgets; experts who've audited setups recommend starting lean, iterating via A/B tests on alert thresholds. That's the rubber meeting the road: simple dashboards beat fancy ones ignored in the heat of action.
Best Practices for Launch and Maintenance
Start with open-source like Plotly Dash for prototypes, hosting on Heroku for free tiers; scale to Vercel for traffic spikes during majors. Backtest rigorously against 10,000+ historical events, ensuring edges hold across seasons; daily scrubs catch API drifts, while modular designs let users swap feeds seamlessly. Communities on Reddit's r/algobetting share code snippets, accelerating builds without reinventing wheels.
And don't overlook mobile views—PWA setups via React ensure oversight on the go, vital as 60% of bets now hit via apps per industry logs.
Wrapping Up: Dashboards as the Edge in Competitive Betting
Those wielding custom dashboards navigate odds seas with precision, turning raw data into profitable actions while overseeing profits through unyielding metrics; as markets tighten in 2026, especially post-March's regulatory tweaks across North America, these tools separate consistent winners from hopefuls. Figures reveal users averaging 15% higher yields, proving the setup pays dividends fast; now the ball's in the court of builders ready to wire it up.