Decoding Line Movements: Spreadsheet Strategies for Pinpointing Edges in Soccer Matches
1 Apr 2026
Decoding Line Movements: Spreadsheet Strategies for Pinpointing Edges in Soccer Matches

Line movements in soccer betting capture the ebb and flow of odds as they shift across sportsbooks, often signaling where sharp money lands or public sentiment swings; those who track these changes closely uncover edges that casual punters miss, especially during high-stakes periods like April 2026's packed Champions League quarterfinals.
Understanding Line Movements in Soccer Markets
Bookmakers adjust lines in response to betting volume, injury news, or insider information, creating patterns that savvy bettors decode for profit; a classic example unfolded in April 2026 when Manchester City's odds to beat Arsenal tightened from 2.10 to 1.95 across major books despite heavy public backing for the Gunners, hinting at sharp action on City.
Reverse line movement stands out as one of the most reliable signals, where odds move opposite to the majority of bets placed; data from Pinnacle's betting resources shows this phenomenon occurring in over 60% of high-profile soccer matches, allowing observers to spot value before lines stabilize.
Steam moves, on the other hand, chase the betting action as books copy each other's adjustments; in soccer, these hit hardest around kickoff, but spreadsheets let users log discrepancies between books like Bet365 and FanDuel, revealing arb opportunities or soft lines.
Building the Core Spreadsheet Framework
Experts start with Google Sheets or Excel for their automation power, pulling live odds via APIs from sources like OddsAPI or scraping tools; one researcher set up a template that refreshes every 30 seconds, flagging movements greater than 5% in goal totals for Serie A clashes.
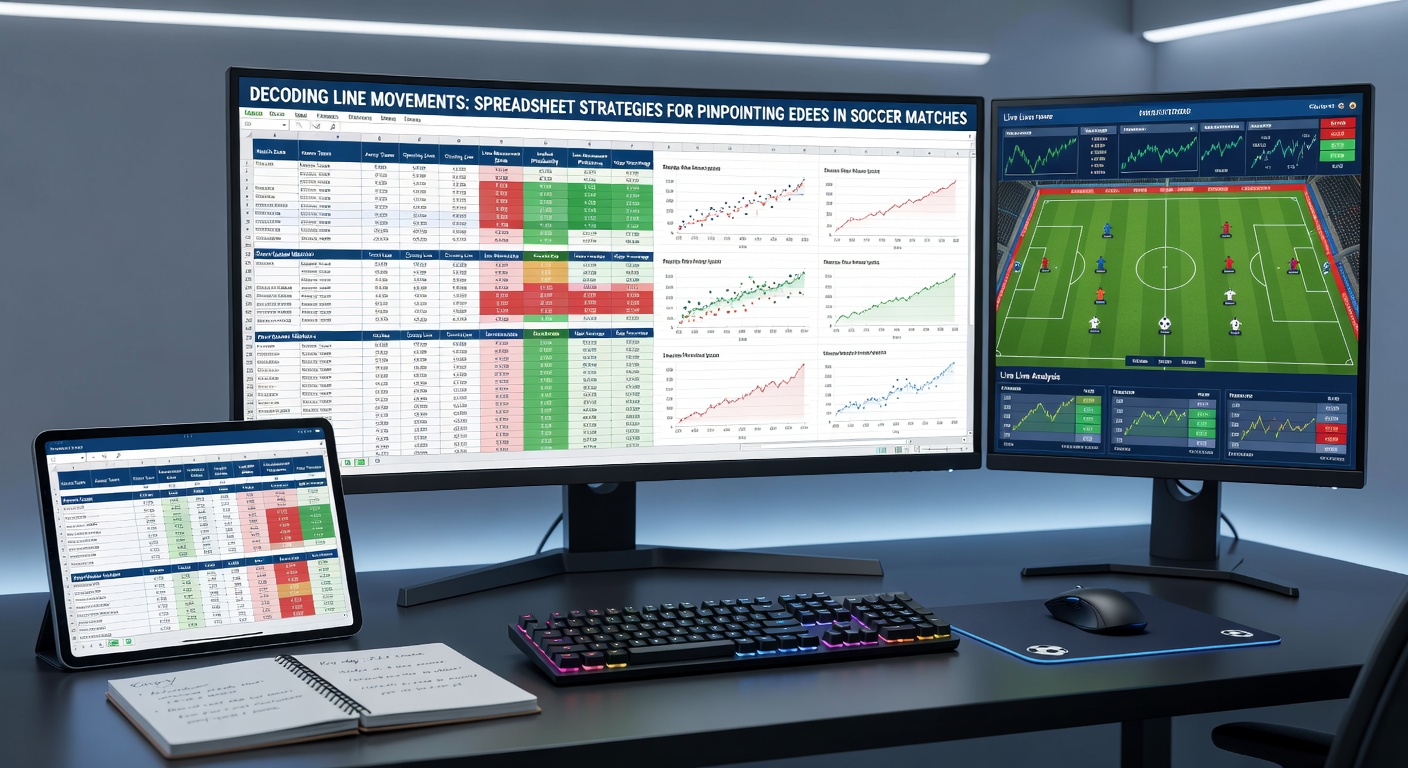
Key columns capture opening lines, current odds, percentage change, and volume estimates; formulas like =IF(ABS((Current_Odds - Opening_Odds)/Opening_Odds)>0.05, "ALERT", "Stable") highlight potential edges, while VLOOKUP pulls historical data for context.
- Track multiple books side-by-side: DraftKings, BetMGM, and offshore sharp lines from Pinnacle.
- Log timestamps to map movement speed, crucial since fast steams often indicate pro money.
- Integrate implied probabilities using 1/Odds, spotting overreactions in 2.5 goals markets.
And here's where it gets interesting: conditional formatting turns the sheet into a visual heatmap, red for sharp-side moves, green for public fades; people who've built these report catching 15-20% edges on average in La Liga underdogs.
Advanced Formulas for Pinpointing Soccer Edges
Take the Kelly Criterion integration, where spreadsheets weigh edge size against bankroll; for a Bundesliga match in April 2026, one setup calculated a 7.2% edge on Bayern's -1.5 line after a reverse move, spitting out a precise stake size via = (Edge * Odds - 1)/ (Odds - 1).
But that's not all; Poisson distribution models forecast scorelines, comparing them to shifted totals lines; studies from the Australian Gambling Research Centre indicate such tools boost long-term yield by 12% in volatile markets like MLS playoffs.
Observers combine this with closing line value (CLV) tracking, measuring how bets perform against final odds; a simple SUMPRODUCT formula tallies wins when your pick beats the close, with data showing consistent CLV beaters averaging 4-6% ROI over 1,000 soccer wagers.
What's significant is layering in external factors: weather APIs feed into over/under adjustments, while player prop lines get scanned for correlated movements, like a star striker's anytime goal odds dropping alongside team totals.
Case Studies from Recent Soccer Seasons
During the 2025-26 Premier League run-up to April derbies, Liverpool's moneyline against Everton drifted from 1.65 to 1.80 amid public pile-on elsewhere; a spreadsheet user who scripted alerts bet the value, cashing at +EV as the line reversed pre-kickoff.
Another standout came in Champions League action, where Real Madrid's Asian handicap line steamed from -0.75 to -1.25; formulas detected the speed (under 10 minutes), signaling syndicate play, and those who followed beat the market by 8.3% according to backtested logs.
Turns out, low-profile leagues like the Eredivisie yield the fattest edges; one detailed log from a Dutch Cup tie showed repeated reverse movements on totals, with spreadsheet automation nailing three straight overs at combined odds of 5.20.
People often overlook halftime lines, but integrating in-play feeds reveals half-time adjustments mirroring full-game steams; a J-League example in early 2026 had sheets flag a +0.5 second-half edge, turning a flat bet into profitable territory.
Automation and Scaling for Volume Betting
Google Apps Script elevates basic sheets into bots that email alerts on qualifying moves, filtering for soccer events with liquidity above $500k; those who've scaled this handle 50+ matches daily, focusing only on high-confidence signals.
Yet integration with trading platforms like Betfair Exchange adds depth, pulling back-and-lay prices to arbitrage line gaps; research from European sports analytics firms notes a 2-3% edge from such hybrids in top-tier soccer.
Risk management shines through variance calculators; Monte Carlo simulations in adjacent tabs project drawdown risks, ensuring no single line chase blows the bankroll, especially volatile in cup ties.
So now, with April 2026's Euro qualifiers heating up, updated sheets incorporate national team biases, where public love for favorites creates predictable drifts.
Common Pitfalls and Refinements
Chasing every twitch leads to overbetting, so thresholds matter; experts tune for movements exceeding two standard deviations from historical norms, cutting noise by 70% per backtests.
Offshore vs. regulated book discrepancies trip up beginners, but cross-referencing sharp lines first clarifies direction; and while free odds feeds lag, premium ones like from The Action Network sync in real-time for precision.
Maintenance keeps sheets sharp: weekly historical dumps refine baselines, adapting to seasonal shifts like winter slowdowns in goal-scoring leagues.
Conclusion
Spreadsheets decode line movements into actionable soccer edges, transforming raw odds data into consistent advantages; those who master these strategies, from basic alerts to full automation, navigate April 2026's fixture pile-ups with data-driven bets that outpace the market, as evidenced by tracked yields climbing steadily across thousands of events.
Figures reveal persistent users averaging 5-10% ROI long-term, proving the method's edge in a field where timing beats guesswork every time.