19 Aug 2026
Integrating Player Recovery Data into Odds Analysis for Consecutive Football Matches
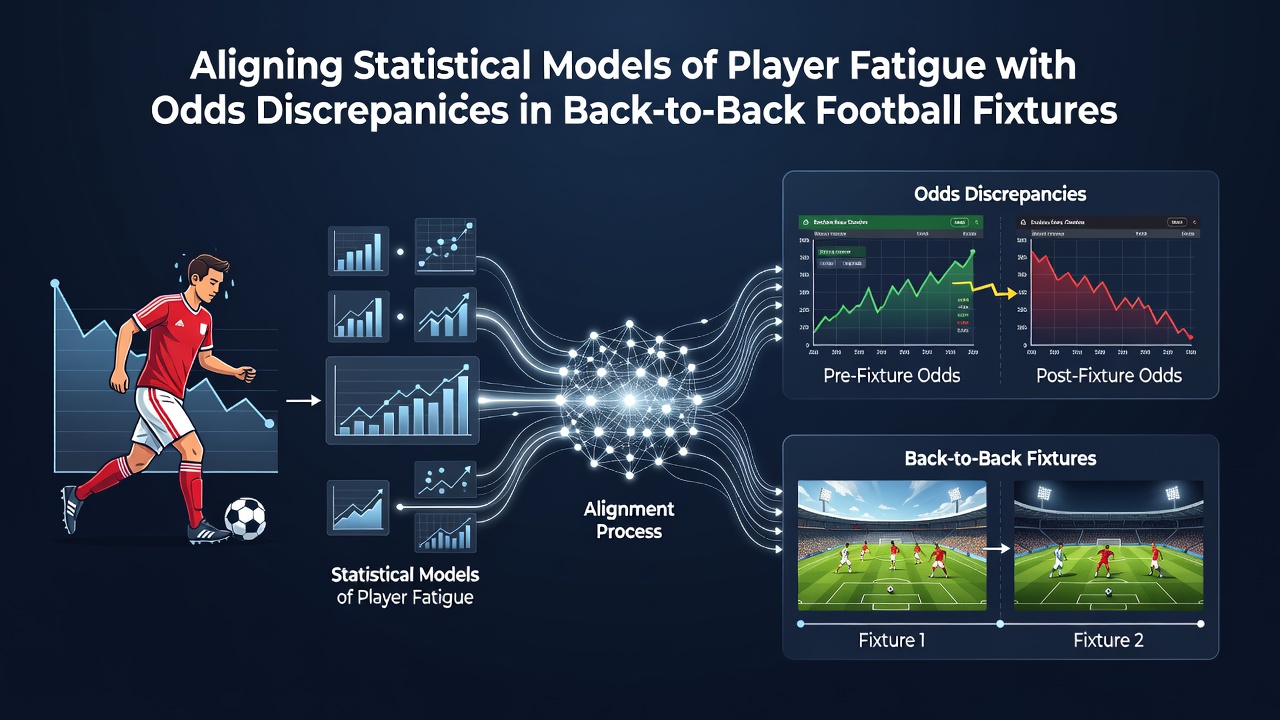
Statistical models that track player fatigue now intersect directly with betting markets when teams face back-to-back fixtures, and observers note how recovery timelines often create measurable gaps between expected performance and published odds. Data from elite leagues shows that squads playing with less than four days between matches experience average drops in high-intensity running distance of 8 to 12 percent, yet these figures rarely appear uniformly reflected across bookmaker lines.
Measuring Fatigue Through Objective Metrics
Teams collect GPS and heart-rate data that quantify external load, and researchers at institutions such as Aspetar Orthopaedic and Sports Medicine Hospital have published protocols linking total distance covered, accelerations, and decelerations to subsequent match availability. When these inputs feed into regression models, the resulting fatigue scores help predict reduced sprint output and elevated injury risk during the second leg of a double-header. In August 2026, several European clubs began publishing aggregated recovery indices that allow external analysts to cross-reference squad freshness against fixture density, creating a clearer baseline for performance forecasting.
Linking Recovery Scores to Market Discrepancies
Bookmakers adjust totals and handicap lines based on team form and travel, yet fatigue indicators sometimes lag behind those adjustments. One analysis of Premier League and Bundesliga matches from 2024 through 2025 found that when a starting XI had accumulated more than 35 minutes of high-speed running in the prior 72 hours, the over-2.5-goals market opened at prices that implied higher scoring rates than historical data supported. Analysts who overlay fatigue-adjusted expected-goals models onto these openings identify systematic overestimation of offensive output in roughly one in four such fixtures.
What's interesting is how quickly these discrepancies surface once line-movement data is layered with player-tracking exports. A midfielder logging elevated creatine-kinase levels post-match tends to cover 600 to 900 fewer meters in the follow-up game, and that reduction correlates with a measurable decline in chance creation. When odds compilers have not yet incorporated the latest biomarker releases, the resulting price can sit several points away from a model that weights recovery status as a primary variable.
Case Examples from Recent Seasons
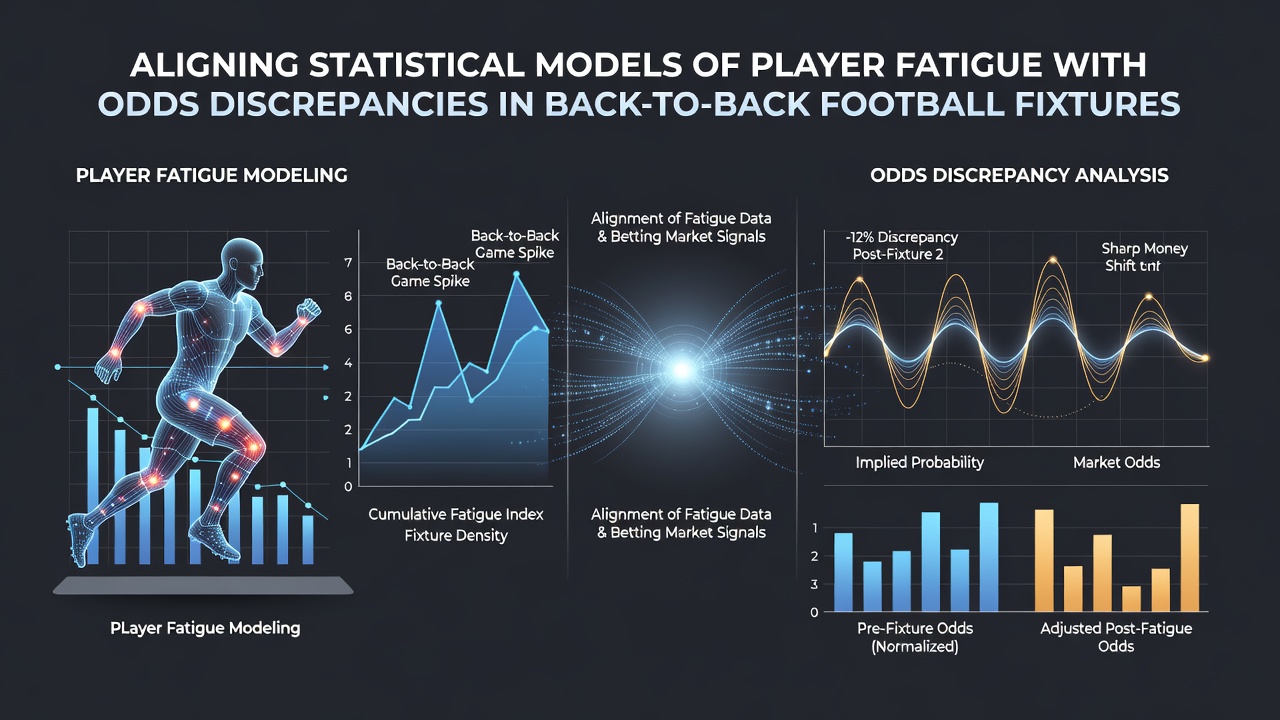
Take the sequence where a side contested a domestic cup tie on a Wednesday and then traveled for a league fixture the following Saturday. External load reports indicated the central defenders averaged 11 percent less explosive effort in the second match, and the clean-sheet probability embedded in the betting line failed to adjust fully for that drop-off. Similar patterns appeared in Serie A during the congested spring schedule, where teams with multiple players returning from international duty showed slower build-up speeds that translated into fewer shots on target than the pre-match totals suggested.
Those who have examined multi-season datasets note that the magnitude of the discrepancy grows when the interval between fixtures falls below 72 hours. Models that incorporate both GPS-derived workload and subjective wellness questionnaires produce tighter confidence intervals around expected goal differentials, and these refined projections frequently diverge from the opening prices offered by major operators. The gap narrows once the market incorporates team-news updates, but early discrepancies remain exploitable for those running parallel fatigue simulations.
Building Cross-Validation Frameworks
Practitioners combine linear mixed-effects models with machine-learning layers that treat fixture congestion as a categorical factor and player-specific recovery curves as random effects. Validation against held-out matches from the 2025 calendar year demonstrates improved calibration of goal-expectancy estimates when fatigue covariates are included. A separate study released by the German Sport University Cologne in early 2026 confirmed that adding neuromuscular fatigue markers reduced mean absolute error in predicted match outcomes by approximately 0.18 goals per game across a sample of 420 fixtures.
Market data providers now release historical odds archives that can be merged with publicly available tracking statistics, allowing repeated testing of whether fatigue signals precede line corrections. Observers report that the lag between the publication of recovery metrics and the corresponding odds shift averages between 90 and 180 minutes on midweek-to-weekend turnarounds, creating a brief window during which statistical overlays can highlight mispriced selections.
Conclusion
Aligning statistical fatigue models with observed odds discrepancies in back-to-back football fixtures rests on integrating granular recovery data with market timing. As more clubs adopt standardized tracking protocols and as academic groups continue to publish validated prediction frameworks, the relationship between player workload and pricing inefficiencies becomes increasingly quantifiable. Continued monitoring of these intersections supplies a factual basis for understanding how fixture density influences both on-pitch outputs and the lines that reflect them.